Background
Before delving into the project itself, it is necessary to look behind the scenes of this redesign:
The Community Manager is a portal for property managers and administrators to interact with their property by gaining access to certain controls such as locking and unlocking doors as well as monitoring statistics such as property occupancy.
Prior to starting this project, the Community Manager was already slated for an end to end redesign as well as adding a few new features. This was something that was just kicking off as I joined the Homebase team.
My role was simply tackling a small piece of the greater redesign. To find a visually appealing and more useful way of presenting data and the most used tools on the platform on the dashboard screen; the first screen the user sees when logging into the Manager. A mobile version was also created for future implementation.
But why? The existing screen was hard and tedious to navigate and didn't give our property administrators the data they needed without spending some serious time trying to find which page of the Manager it was on. Property managers are busy people and need to see the information they need as quickly as possible and in an easily digestible fashion.
I worked alongside Jared, VP of Product, who was tackling the broader redesign, Justin, front-end developer, for his technical knowledge as well as Blake, the CEO, for his final input into the look and functionality of the dashboard.
The Version 1 Community Manager which was in the process of redesign.
Step One: Research and Ideation.
Before starting the actual design process, it was necessary to know exactly what kind of information property managers wanted and needed to see on their dashboard.
We had some existing data on this from the inception of the Community Manager but both Jared and I felt that might be outdated and could use a fresh perspective outside of the small community of property managers already using Homebase.
I ended up creating a Google Forms document containing questions about the kind of data that property managers needed to see, how they like to see specific kinds of data presented and, any wishlist items that they would have available to them in an ideal scenario.
From here, I posted the Forms link to various online communities and forums relating to property management, renting and property ownership and then compiled all of the data into a basic summary that I then used to create user stories and build into sketches.
Step Two: Sketches.
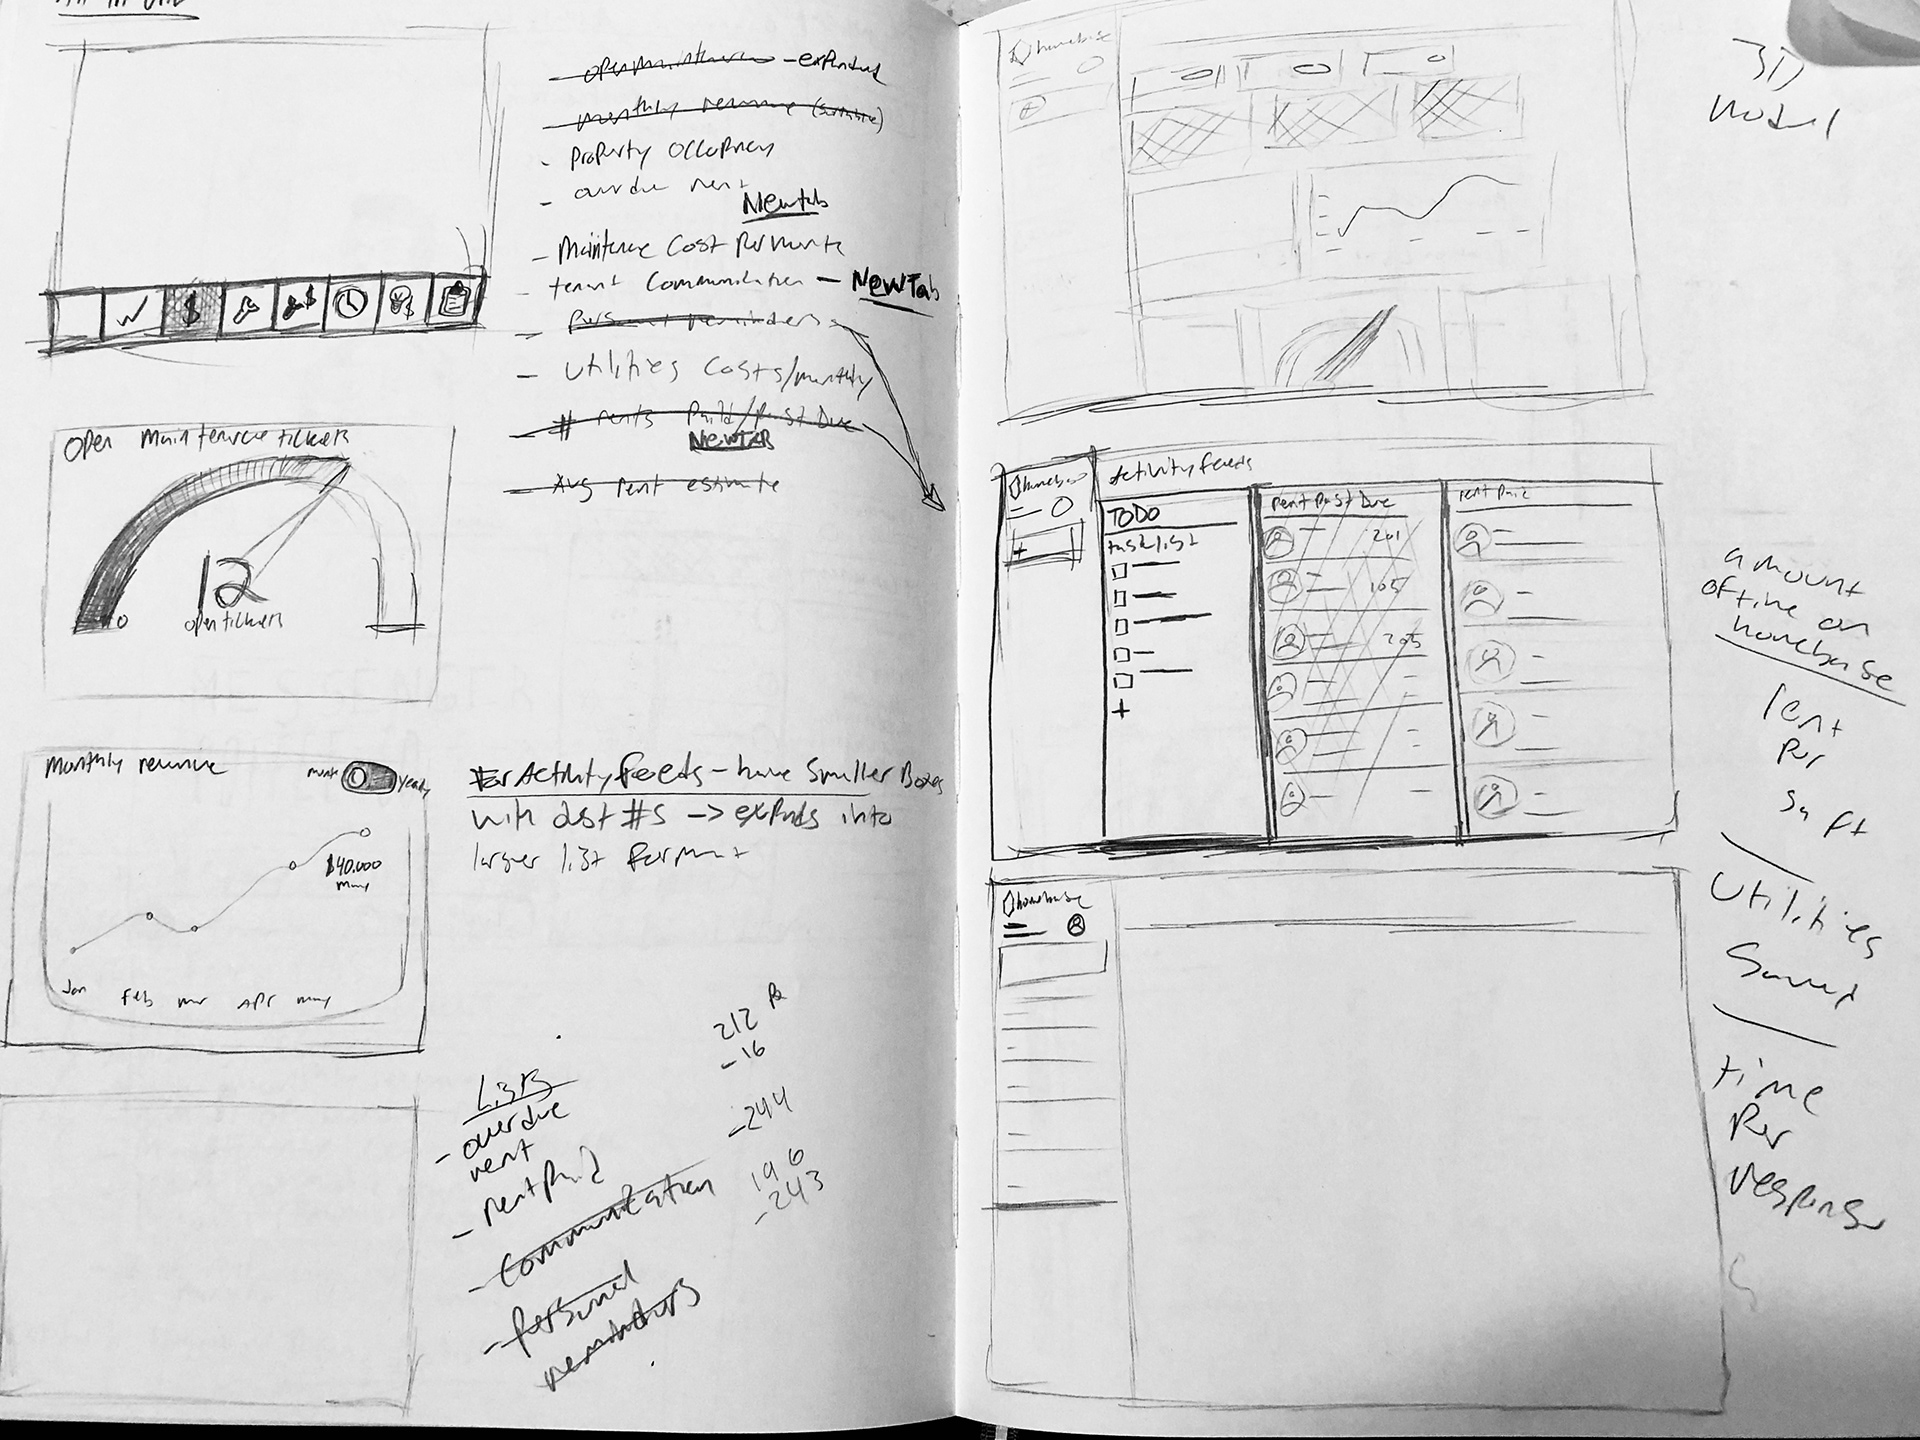
After compiling the Forms responses and building user stories, it was time to consider the design direction on a high level. I knew that there needed to be a level of simplicity to the layout, not only because that was a growing theme in the redesign but also because data and analytics can get messy and complicated quickly. Everything needs to be easily digestible at a glance.
I knew that I wanted this to be one page so as to not overcomplicate anything. And it was necessary to only include the most important selection on analytics which we found out from the Forms responses which I decided to orient in a neatly organized freeform grid format.
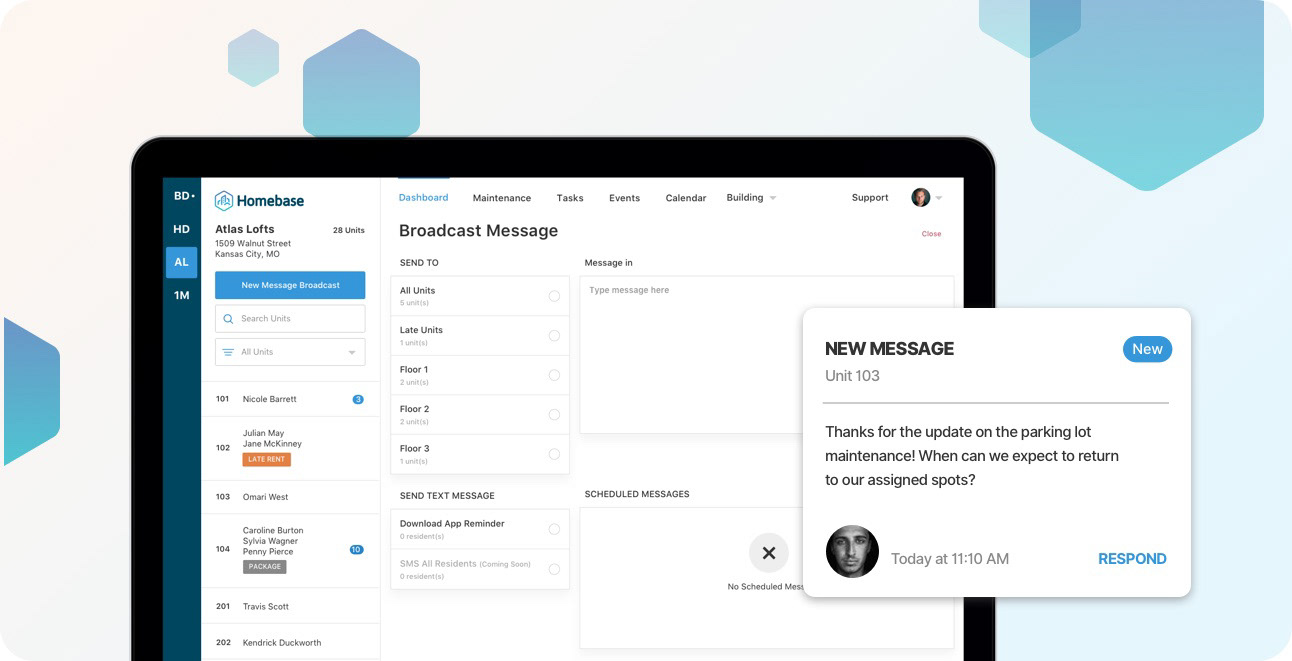
Rough Initial Mockups
As a rough draft, I first mocked up some different graph styles to visually see which of them seemed to work the best in illustrating data. It is also worth noting that all of these came from the inspiration of Chart.js which was recommended by the development team as a way to ease the development load as these charts/graphs come as extremely editable templates thus cutting down the development time.
Additionally, I used this as a way to visualize color choices and layout size for all of the containers.
When it comes to rough drafts, I find it is best to create a quick screen with a few objectives like checking color relationships and how sizing works between elements and then immediately move on to a new screen utilizing old elements while implementing any changes.
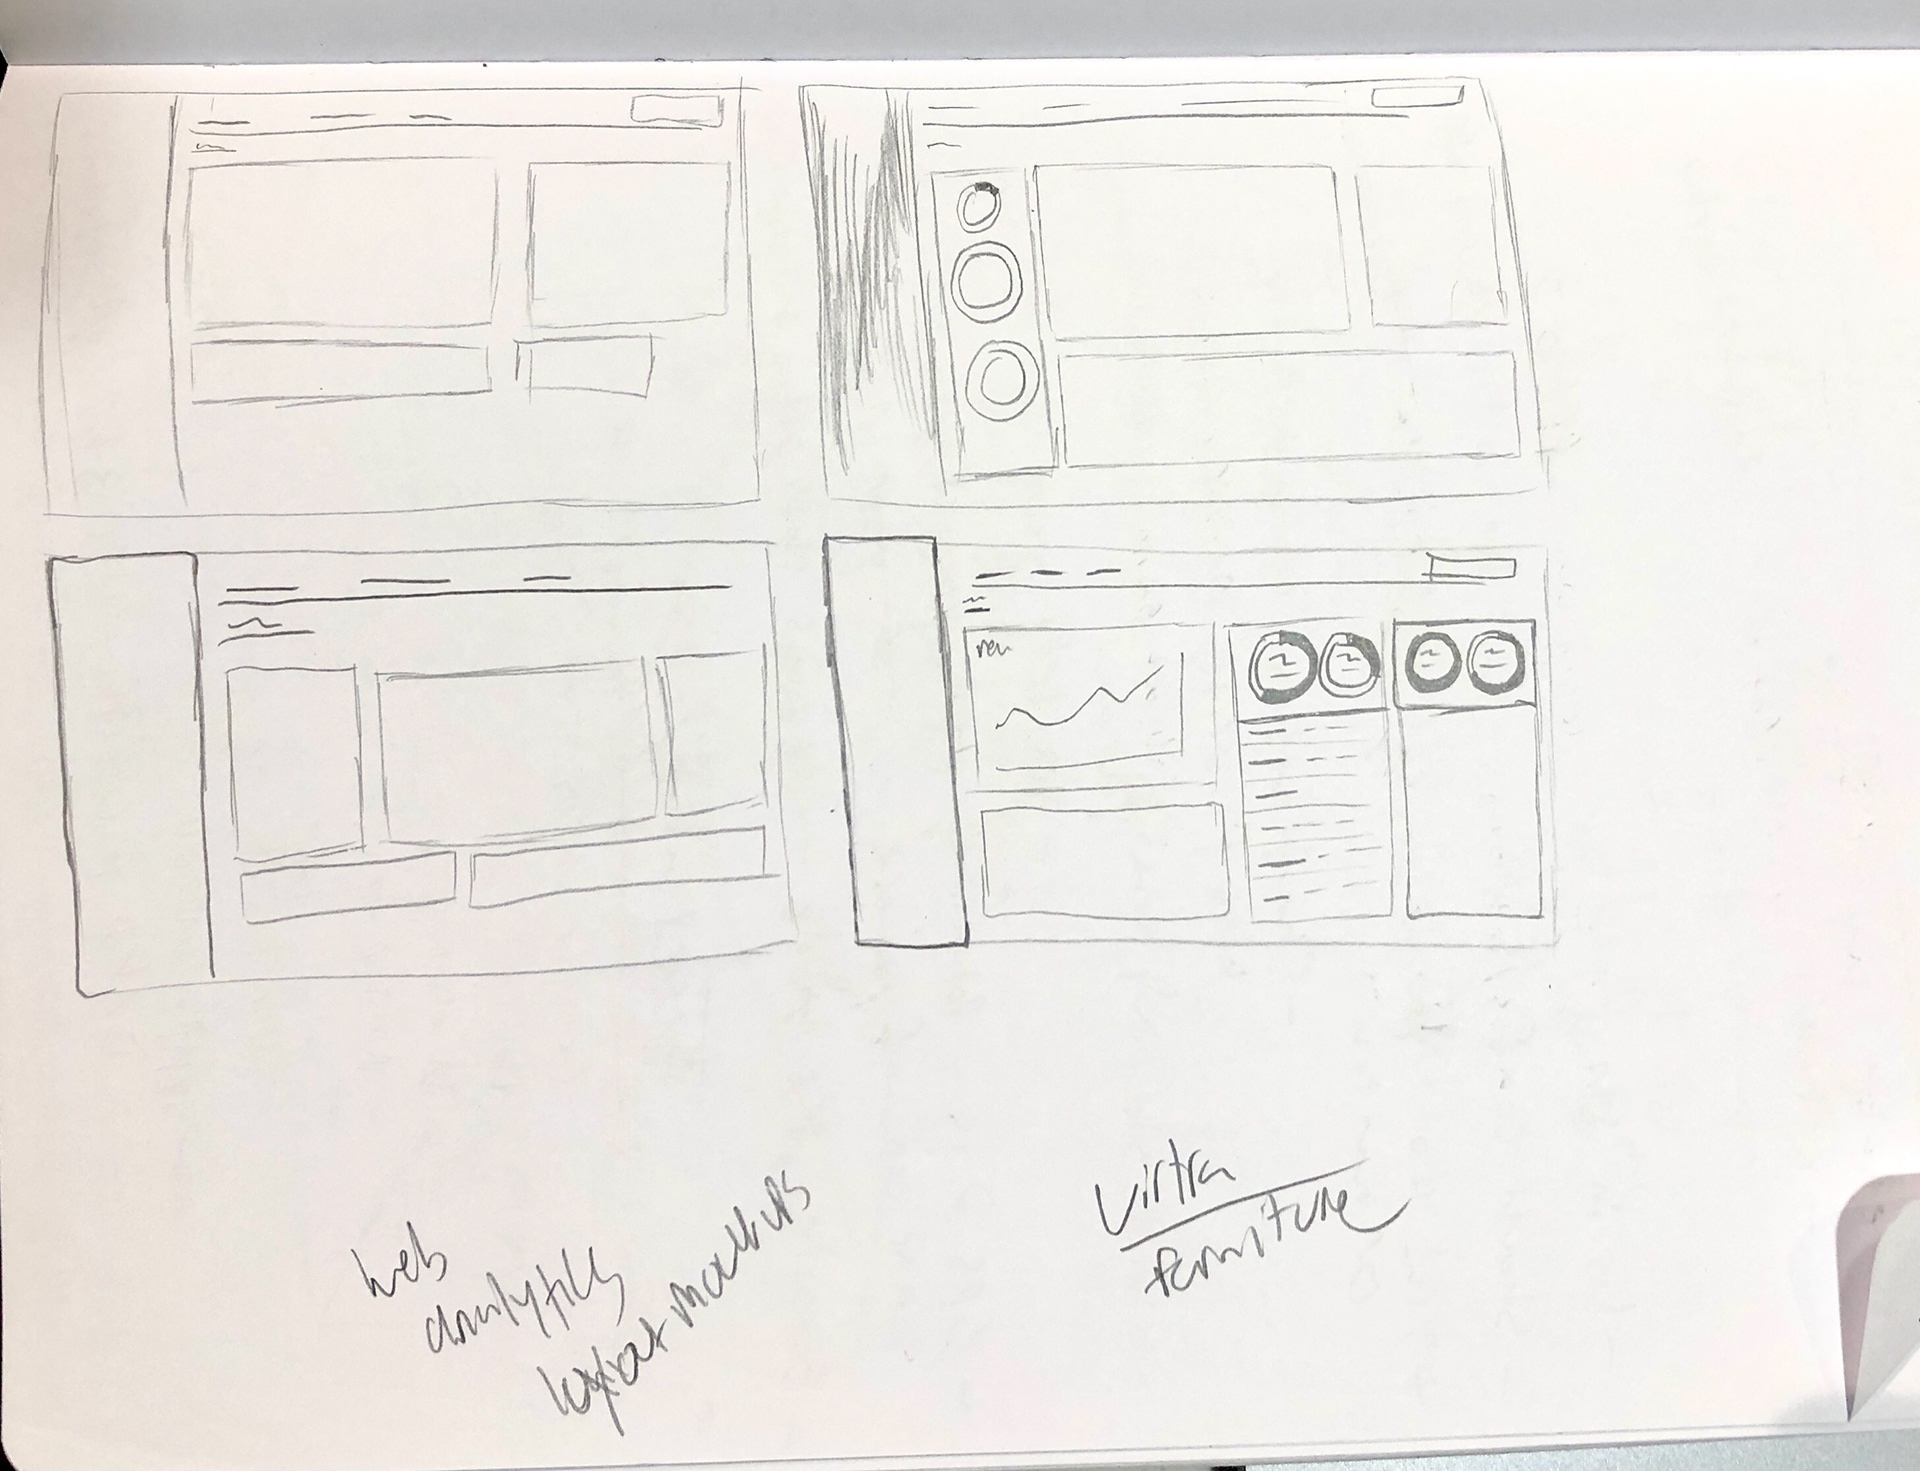
Refined Mockups
From the rough draft, I decided to change the green color to blue to fit in with the brand colors as well as refining the breadth of data visualization down to a small selection of graphs: "Doughnut" graphs, "doughnut" graphs with lists, line and bar graphs.
This cut down on the amount of mental processing the user would have to do as well as the fact that these three visuals are most easy to understand over some of the others I used in the rough mockup.
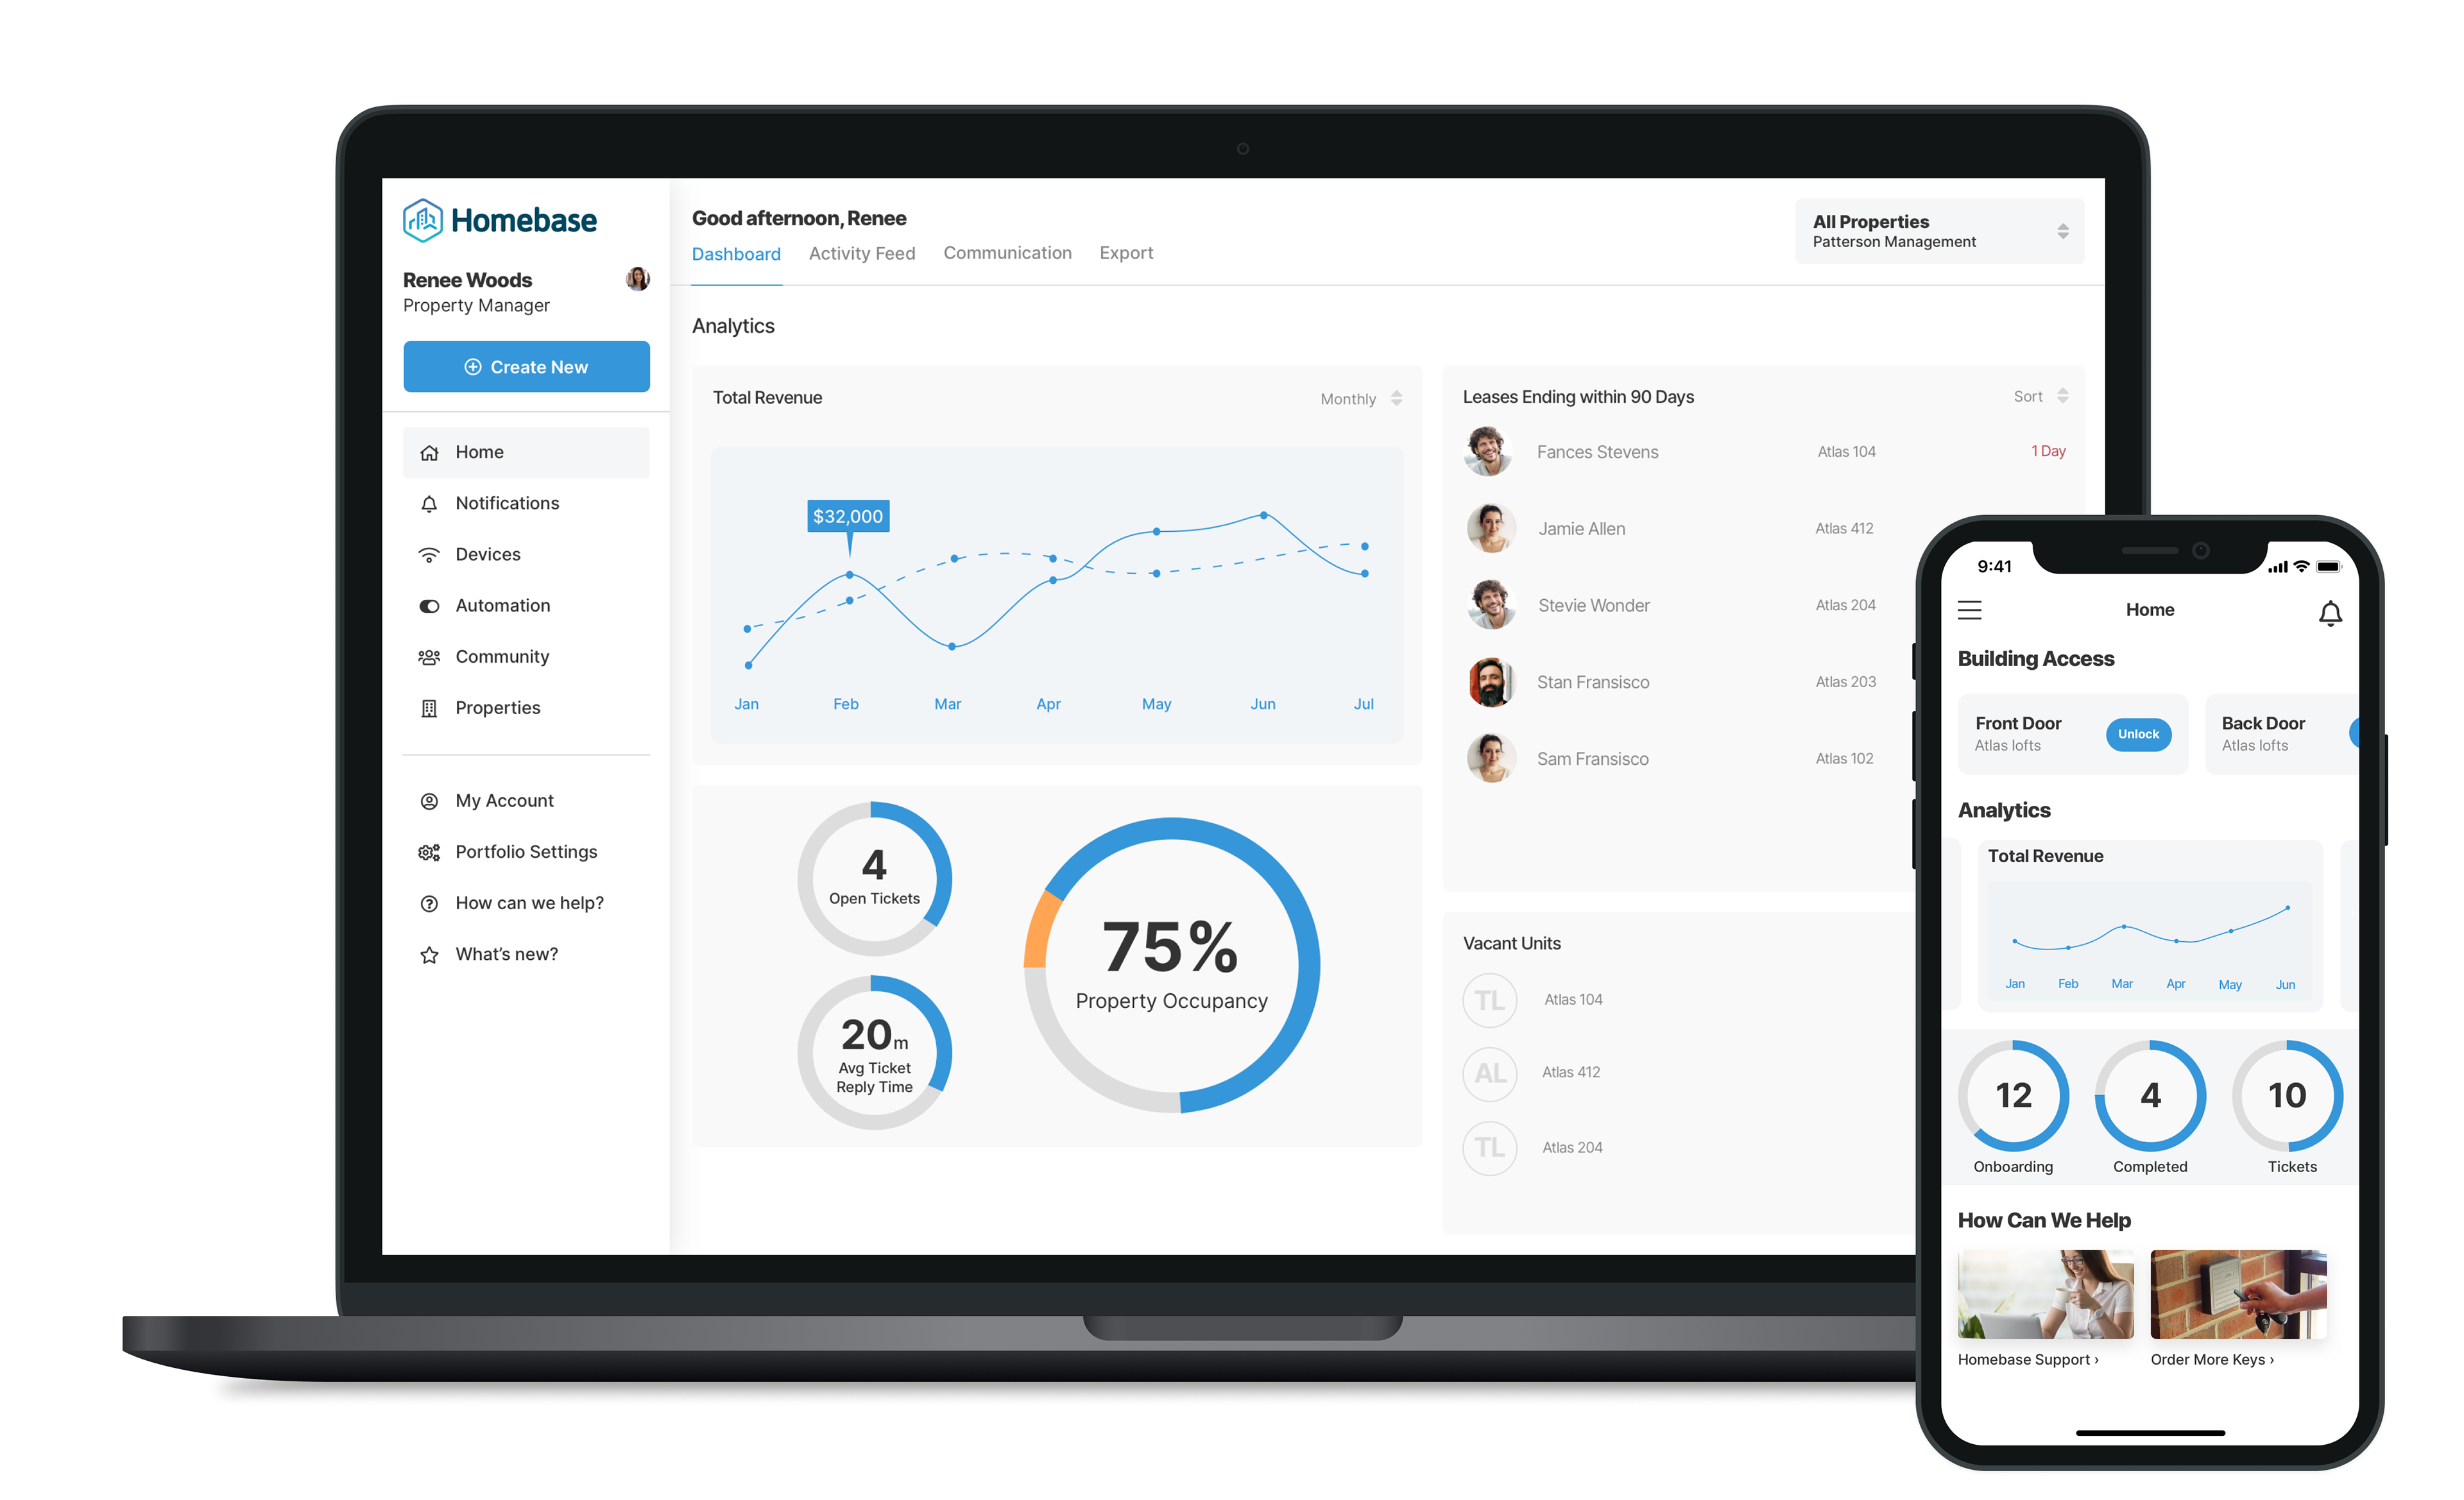
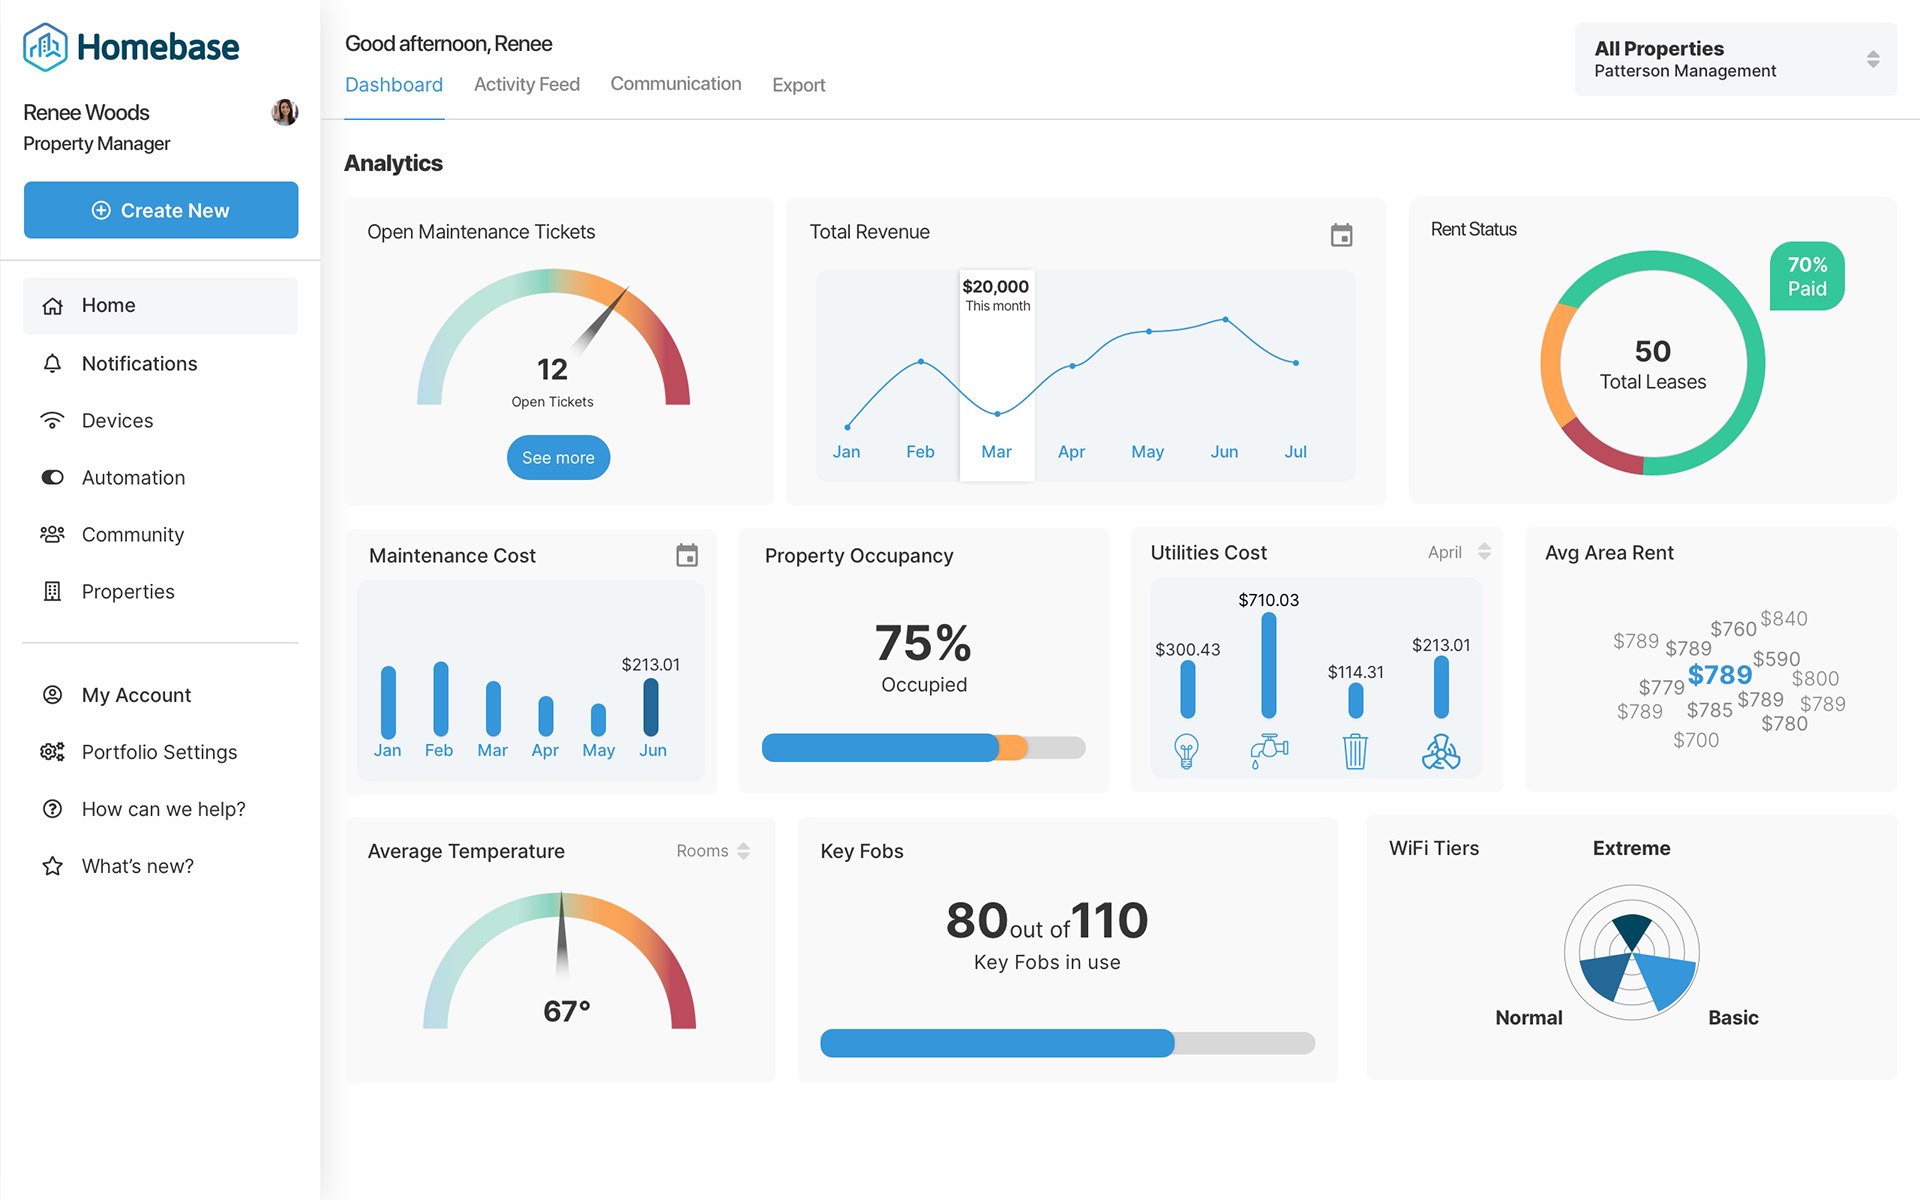
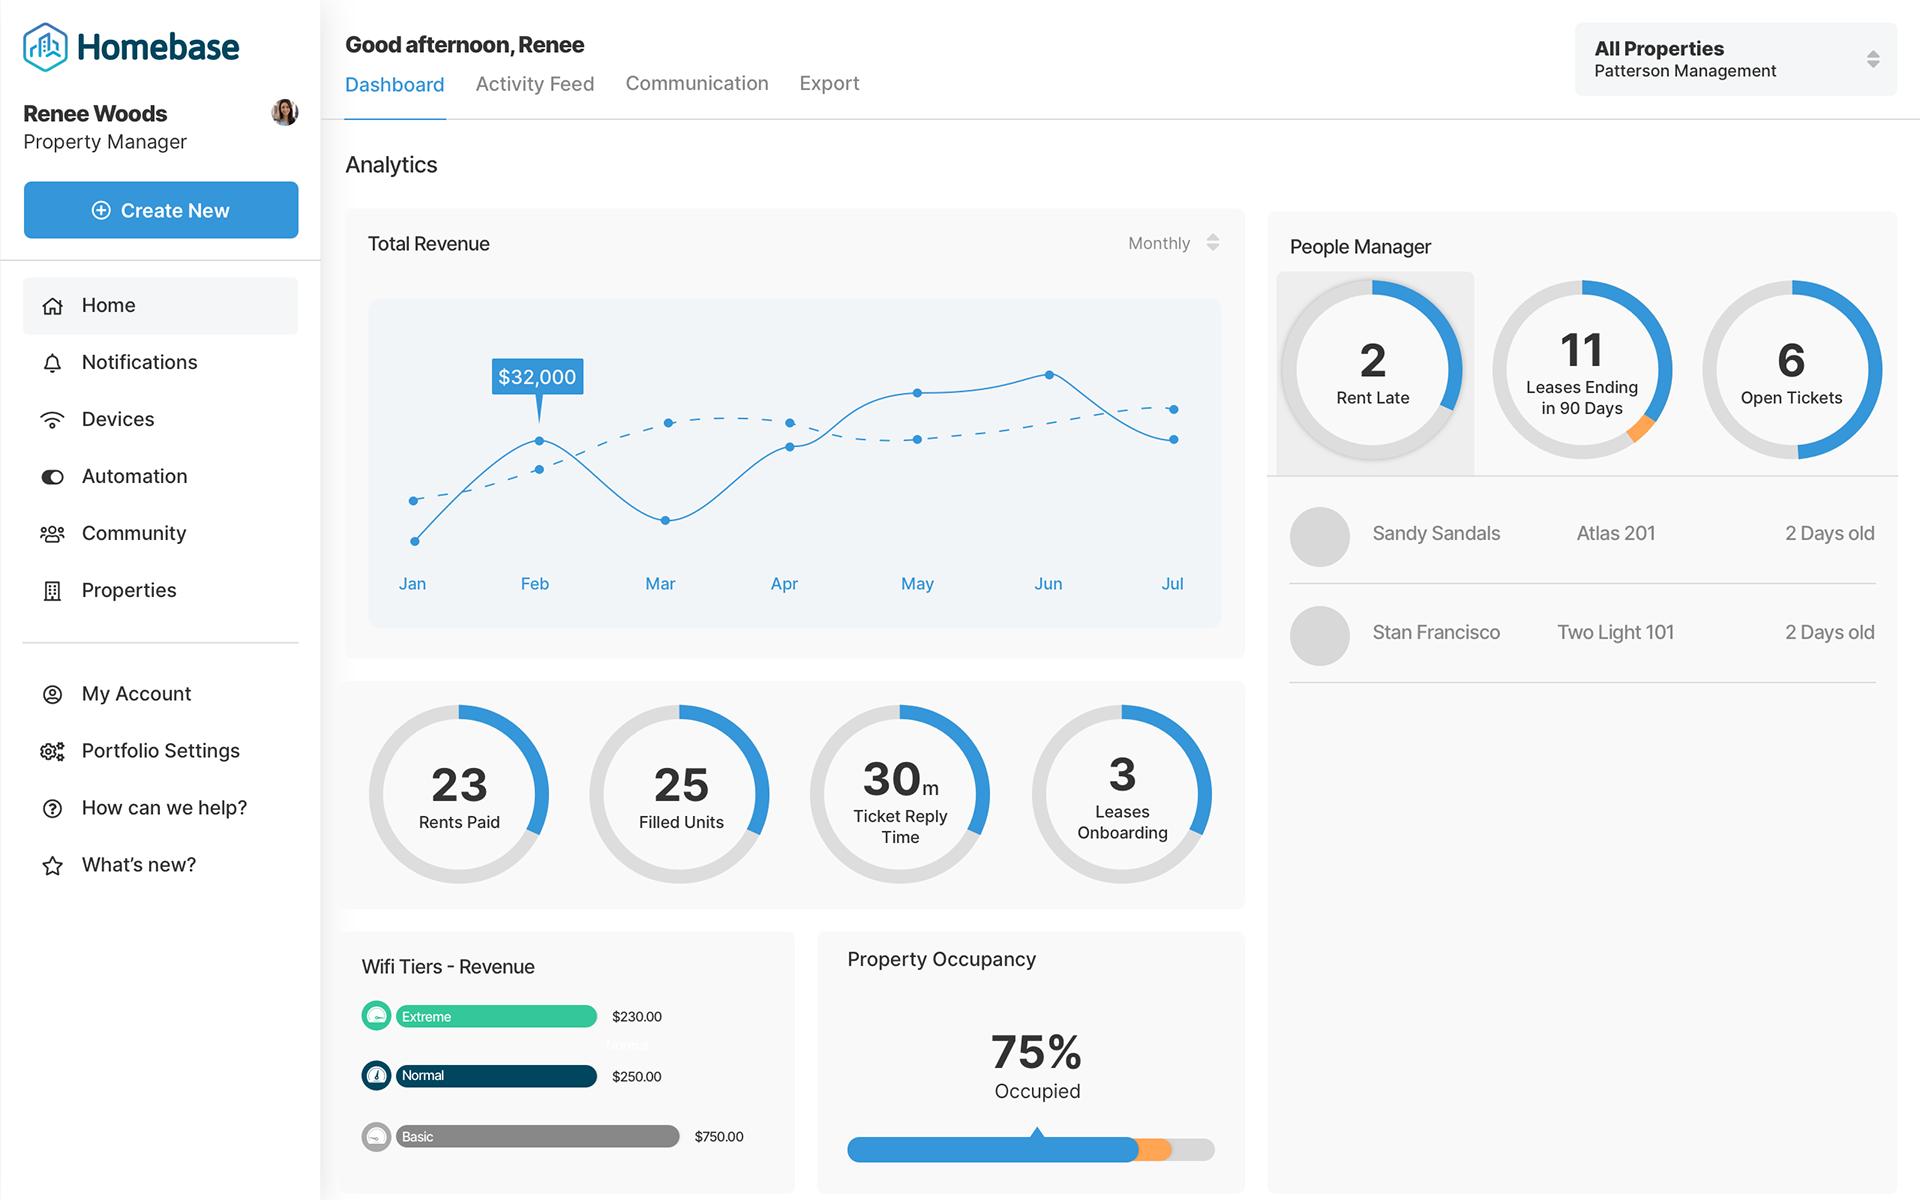
Final Product
The final product had only a few minor visual changes but a sizable technical change. The visual change included making the containers of each visual element bigger and in more of a "brick" idea. The idea behind this change was that there was more of a focused approach to what the manager would see initially. The large technical change comes with the idea that all of these containers, which I call "widgets", can be interchanged by the user with a large collection of other widgets containing different kinds of information that would be relevant to the user.
By default this dashboard page comes as a single page with three widgets on it but could be expanded and customized to a scrollable page with as many widgets on the page as the user finds valuable.
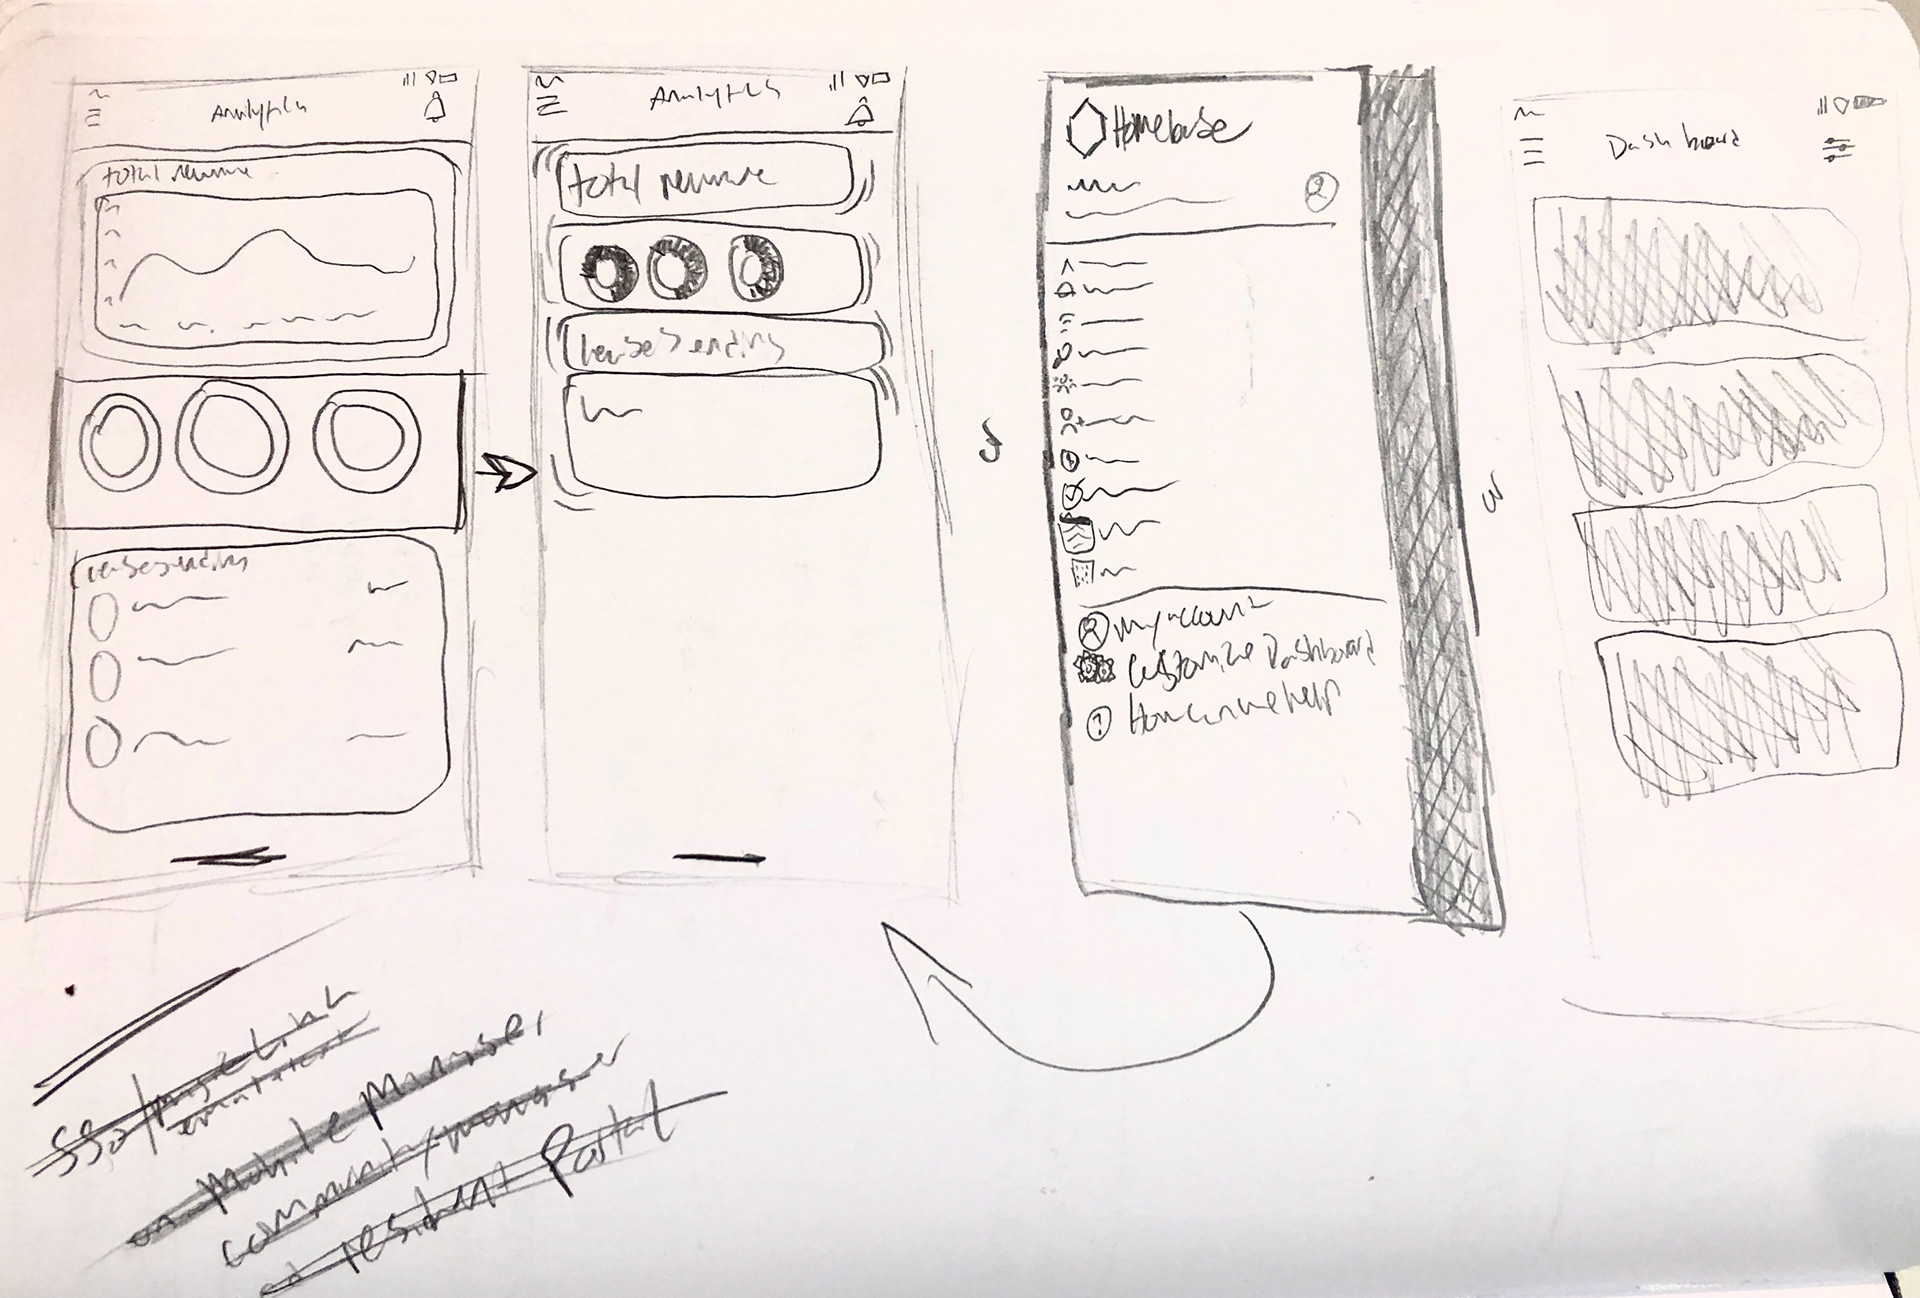
Expanding to a Property Owner and Maintenance department view
In some situations, the user may not be a property manager but maybe a property owner, or a maintenance team. Because of this, their needs will be different than a property manager. Screens designed toward a certain role will be presented to users of a certain role based on the level of access that their platform login allows.
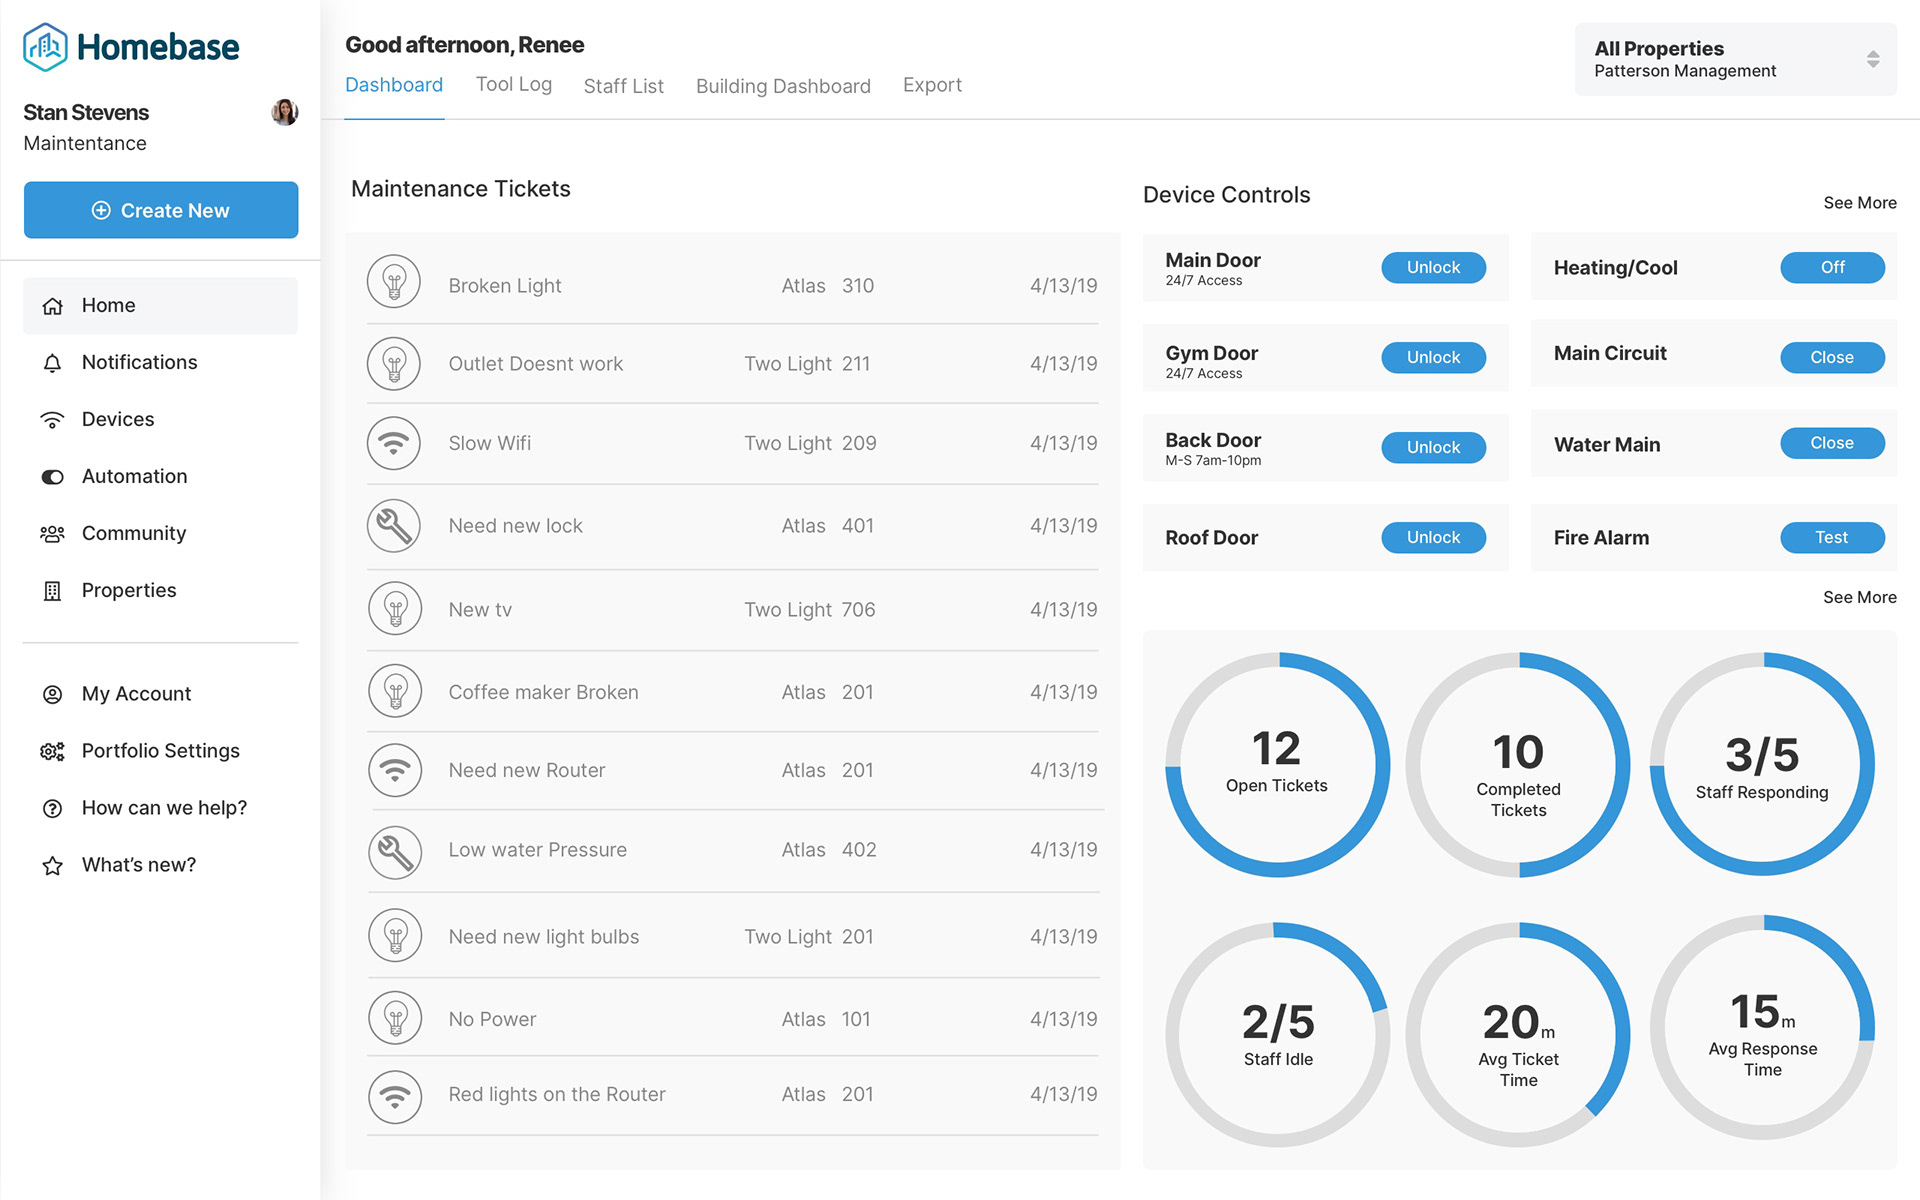
The maintenance screen focuses mostly on the maintenance tickets side of the property. By default, this screen will show a list of all of the open tickets, some data on how many tickets are completed and open as well as some staff stats such as how many are responding to tickets.
Additionally and most importantly, maintenance can also control all of the smart devices on the property such as public doors (locking or unlocking,) resident doors with their permission, and other more obscure smart devices such as testing fire alarms, water mains, and IoT main power circuits. There is an editable panel that shows the various controls.
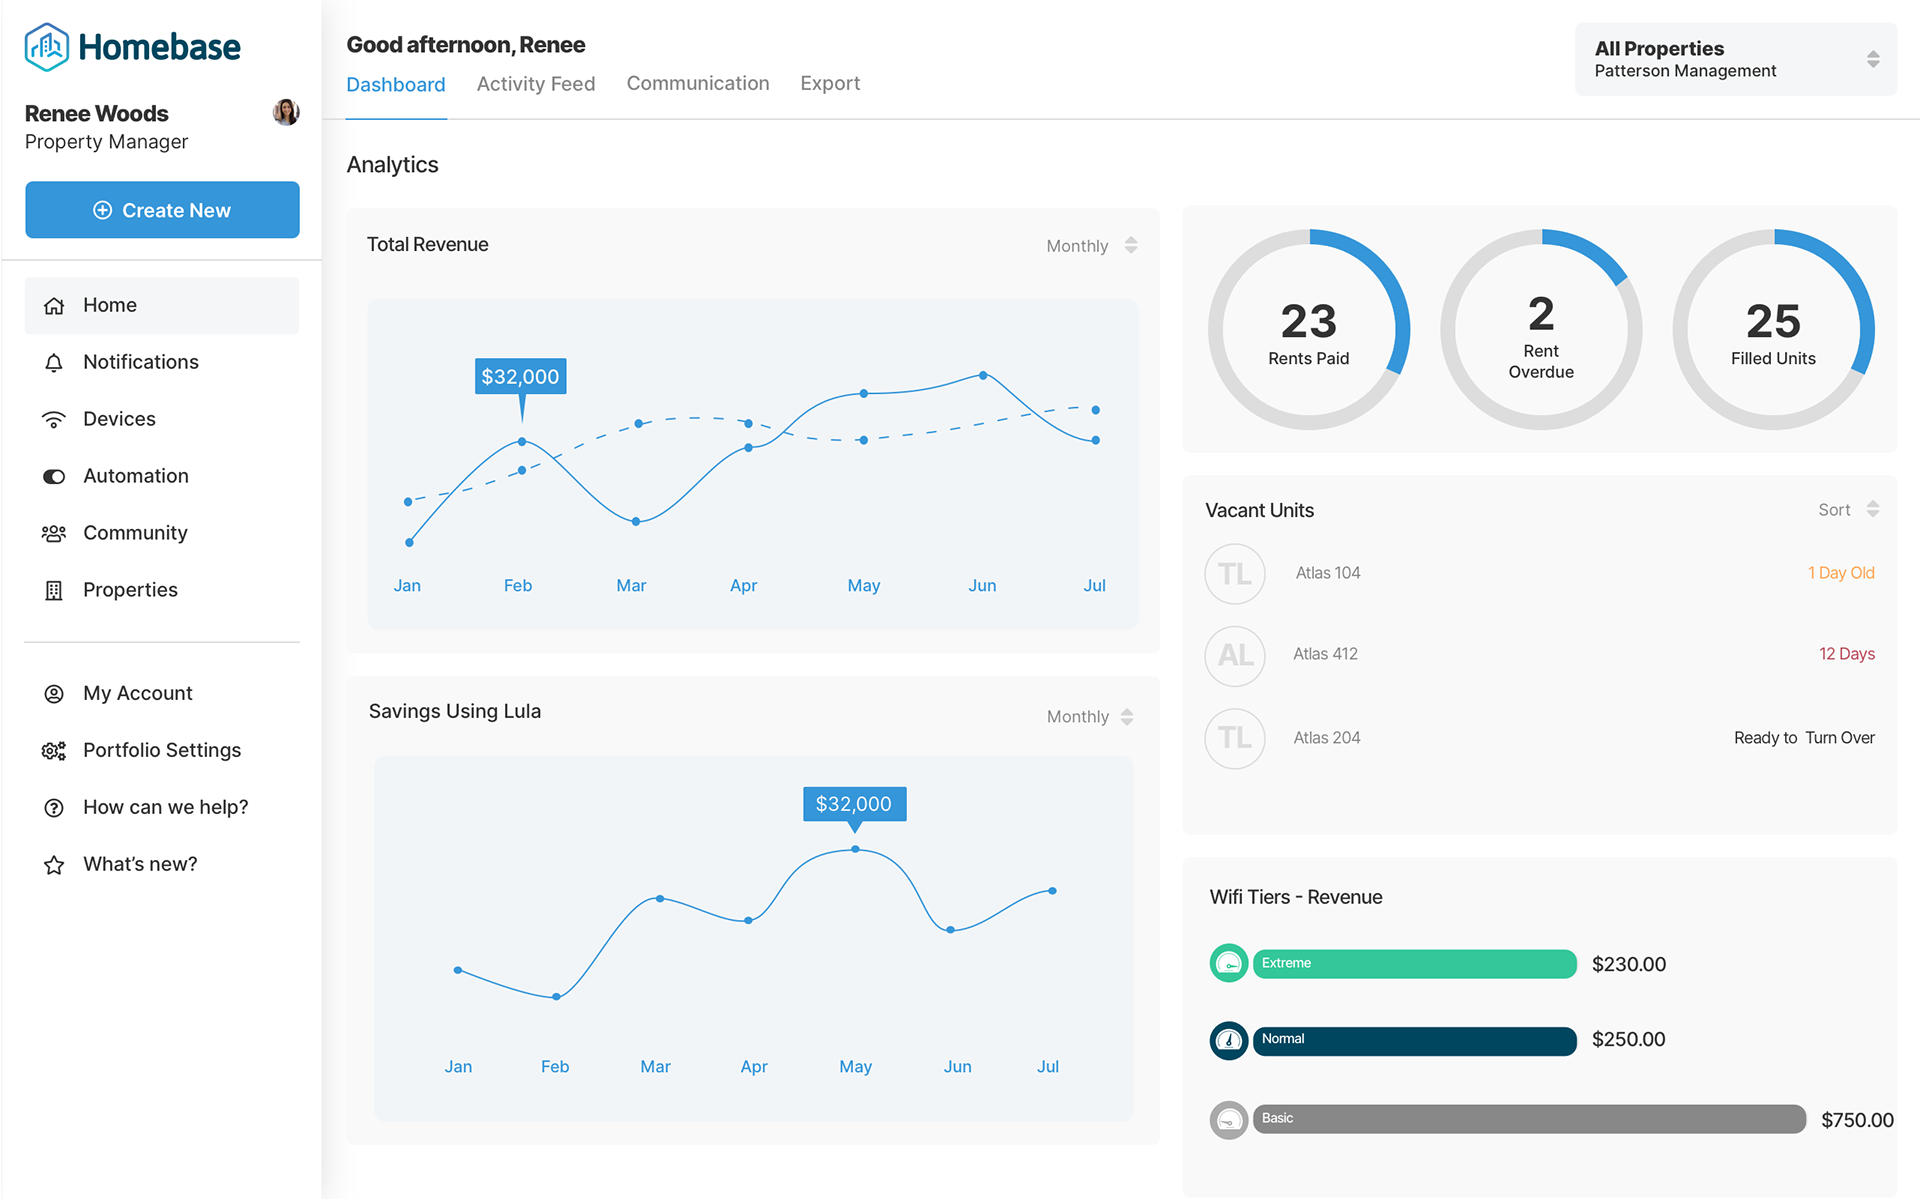
Some data from our initial research suggested that there was a distinct difference in the data that property owners wanted to see versus that of the property manager. This data usually has more to do with the overall financial health of the property. As such, the default panels for the property owner role focus on overall revenue, any savings, and the property occupancy.
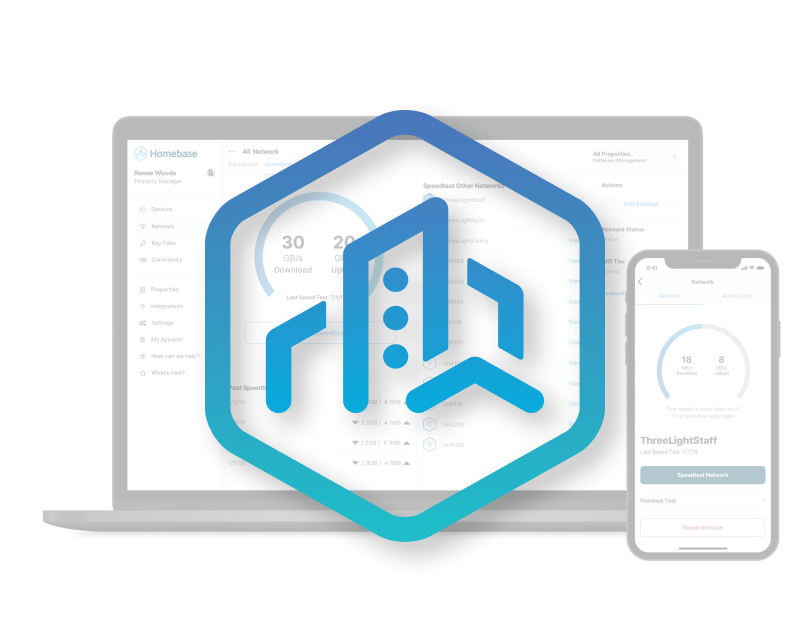
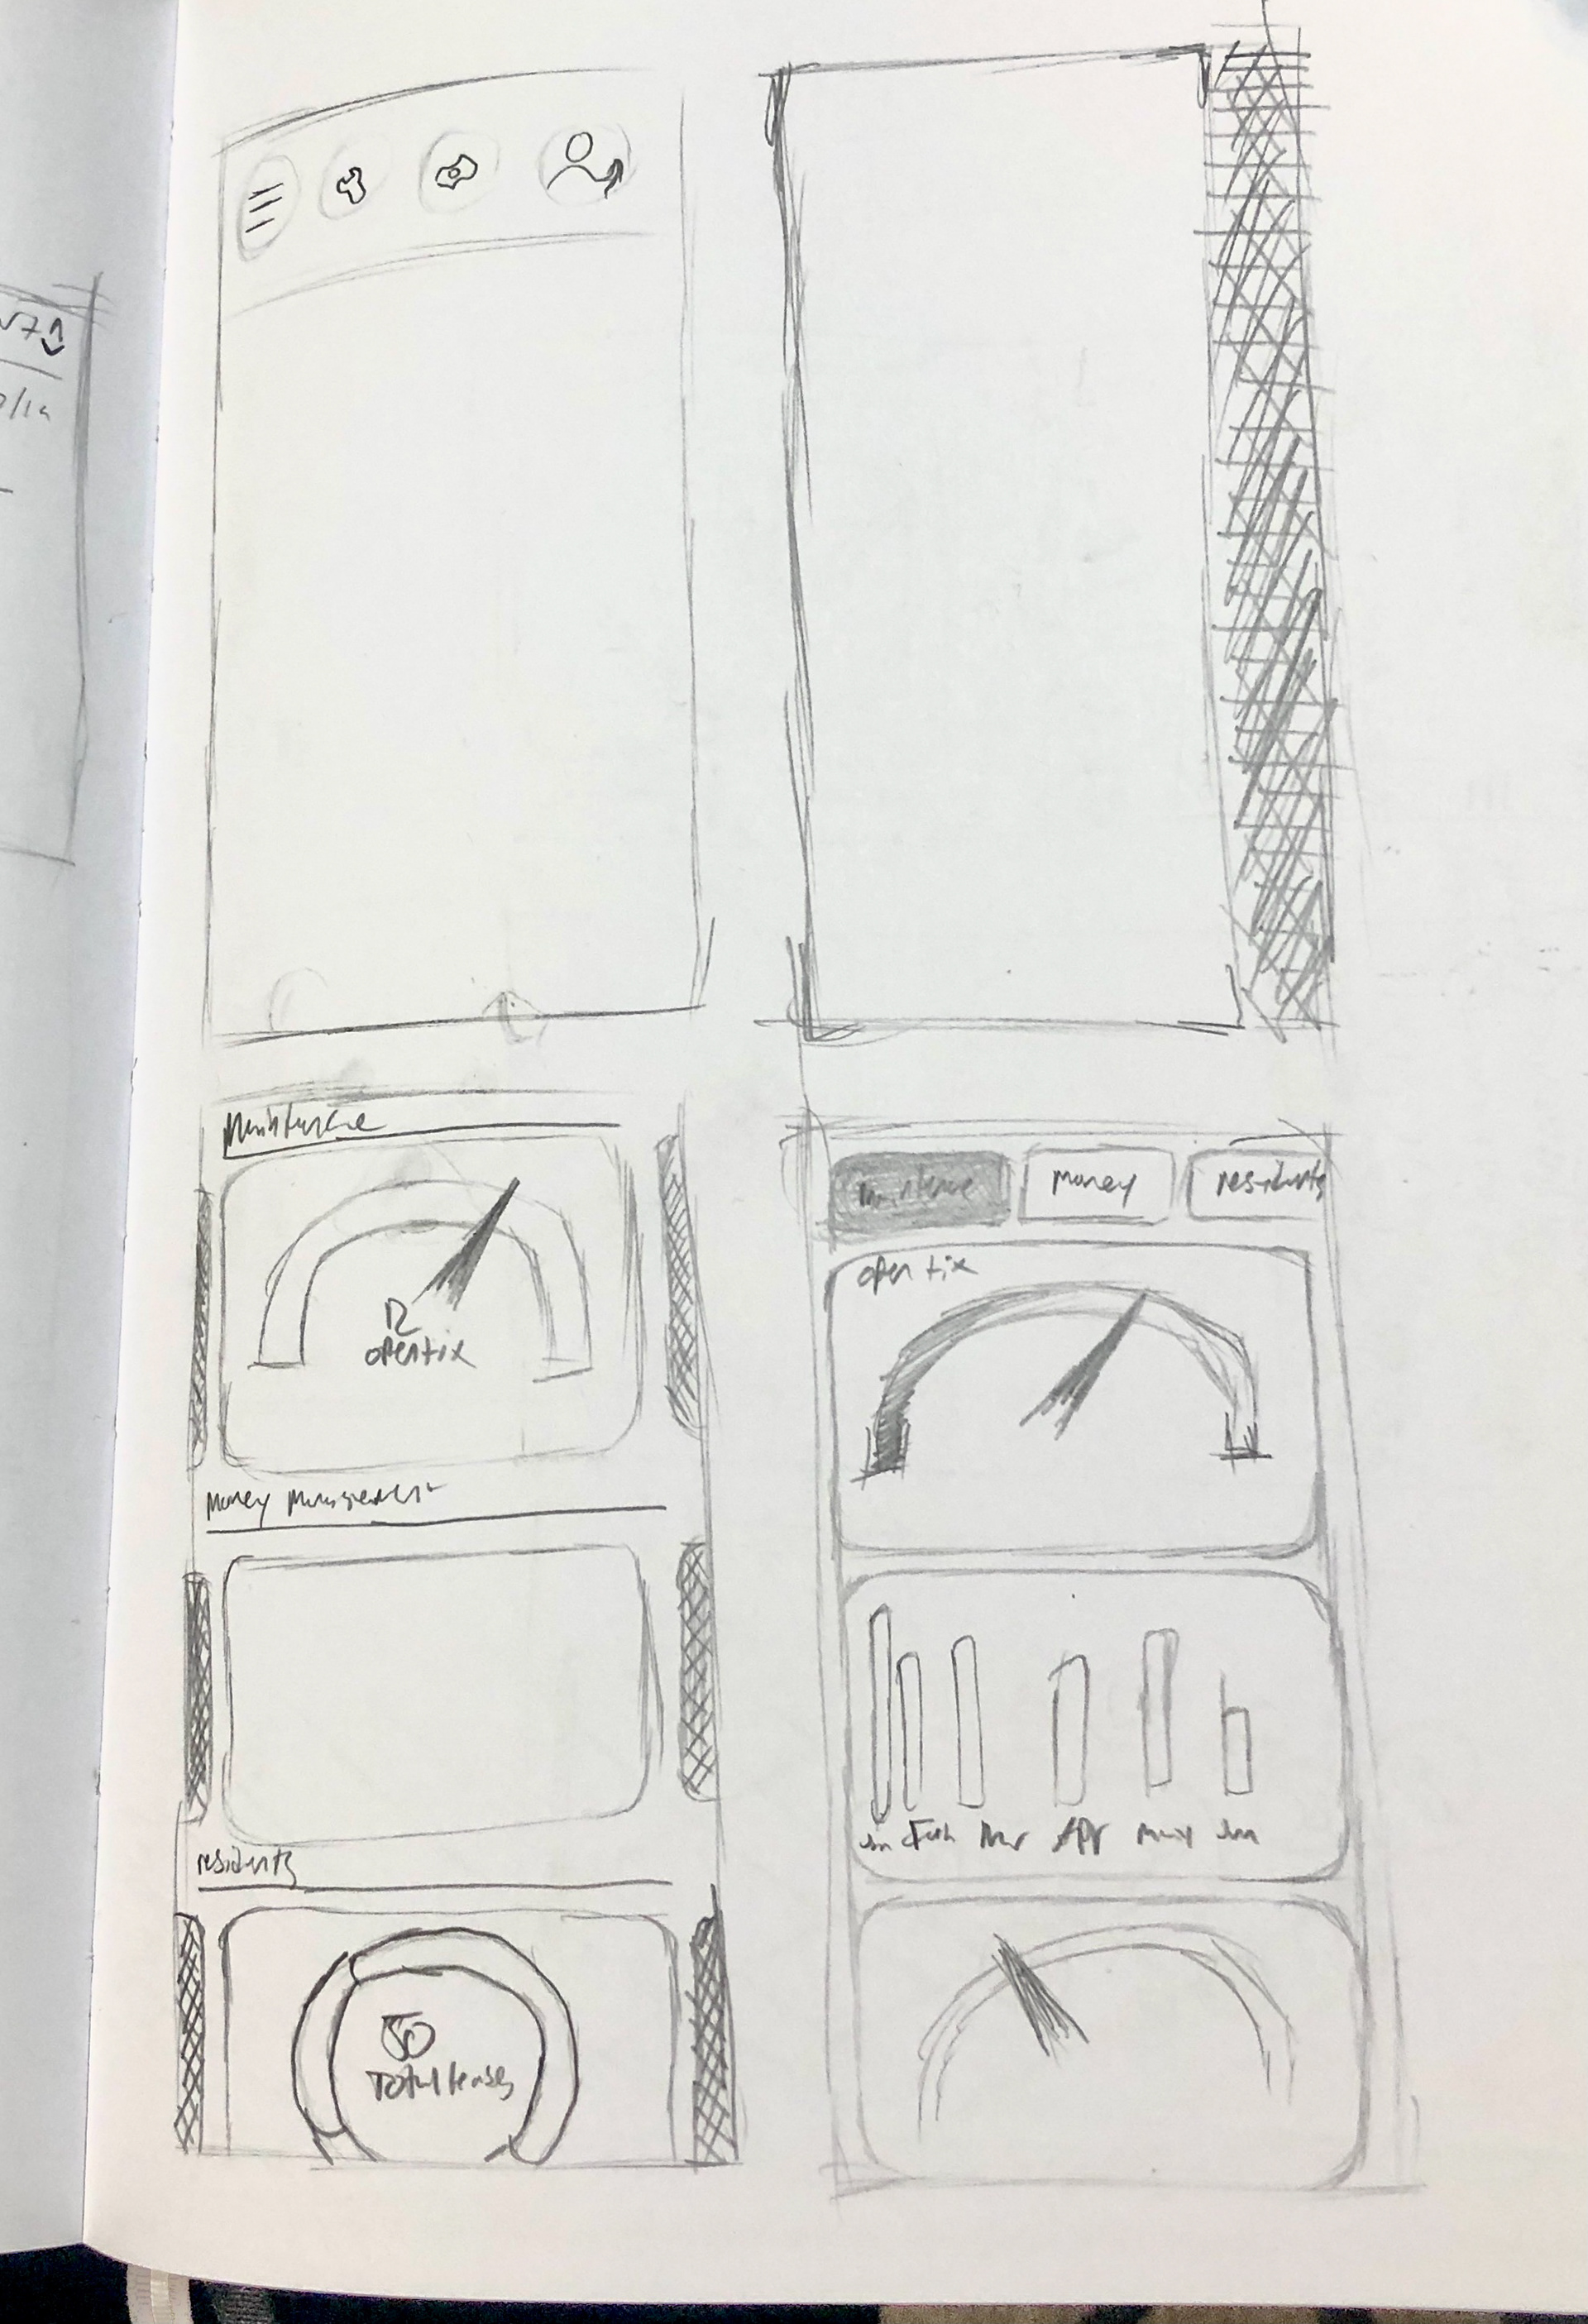
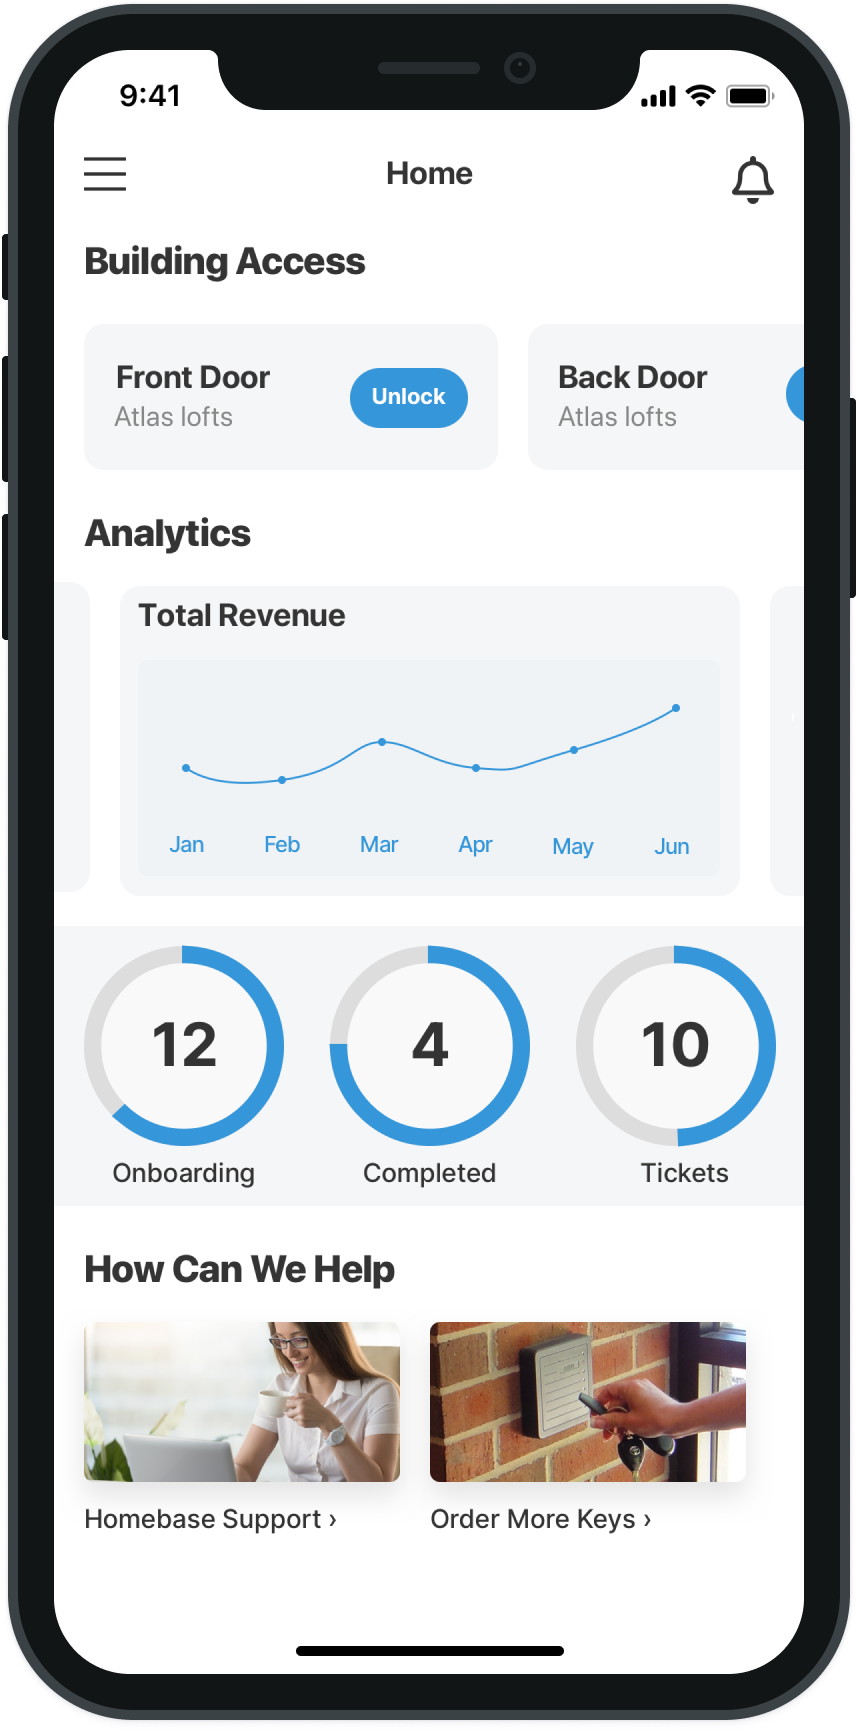
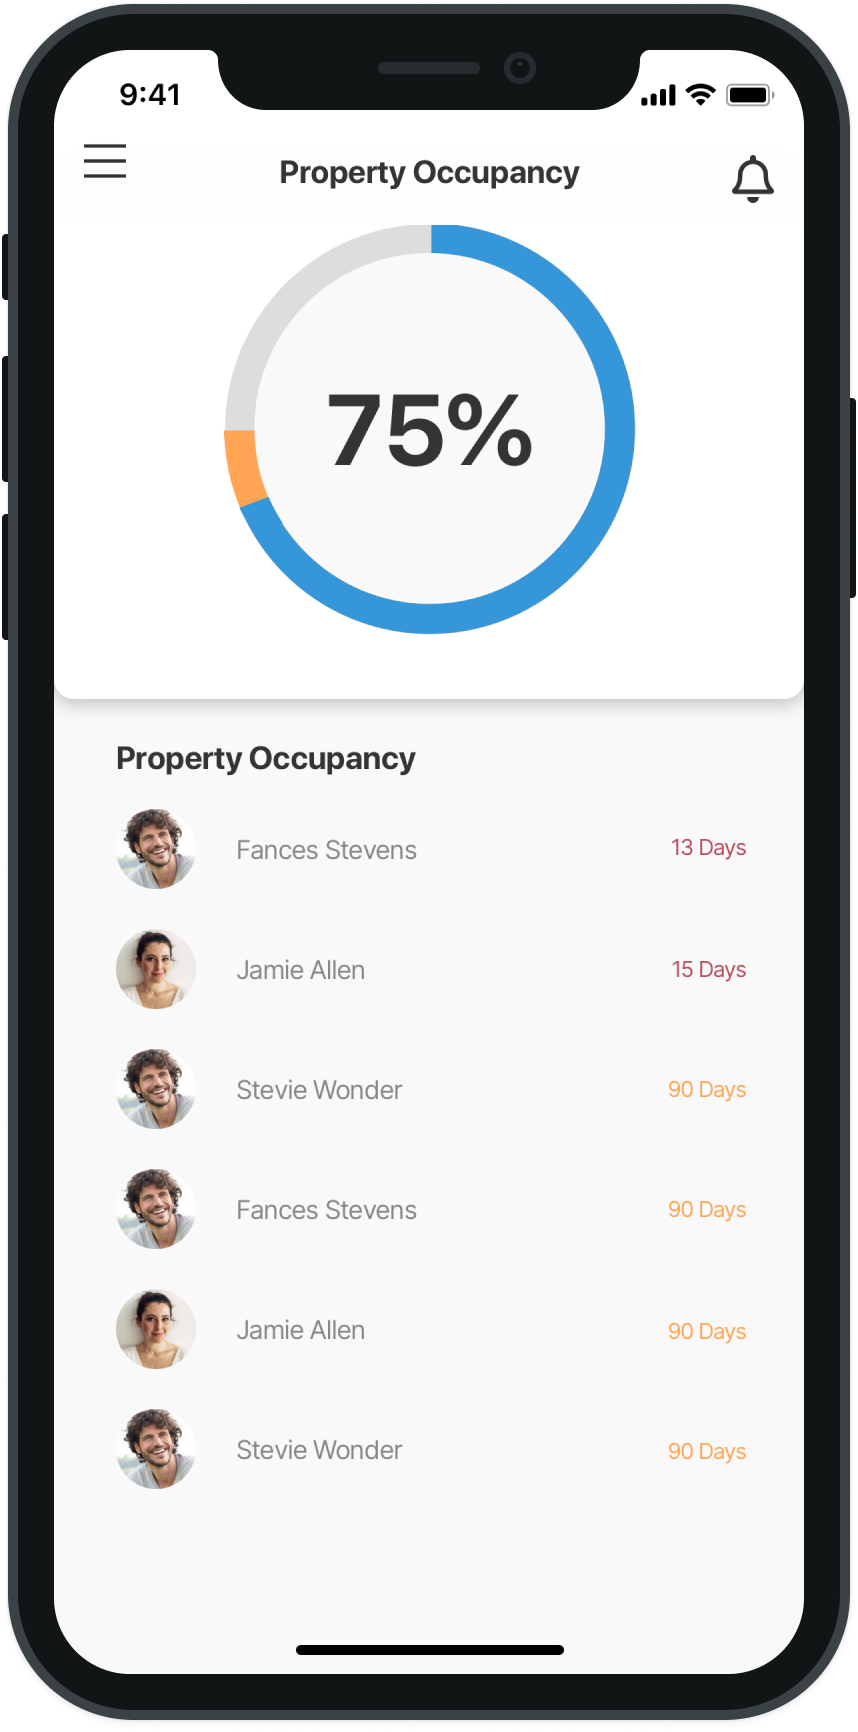
Mobile
Animations
Below is a refined selection of some animations to be handed off to developers to reference how interactions should look.
Tab navigation animation
Hover state animation
Error banner animation